
Cedar Global Markets
Subscribe
SAVED POSTS
  • Login
No Result
View All Result
  • Home
  • Markets
  • Economy
  • Business
  • Energy
  • Technology
  • Global
    • Middle East
    • Europe
    • Asia-Pacific
    • Americas
    • Africa
  • Opinion
No Result
View All Result
  • Home
  • Markets
  • Economy
  • Business
  • Energy
  • Technology
  • Global
    • Middle East
    • Europe
    • Asia-Pacific
    • Americas
    • Africa
  • Opinion
Cedar Global Markets
US 2Y4.73%
US 10Y4.98%
US 30Y5.35%
2s10s+25bp
WTI$89.62
Brent$92.14
Fed funds3.75–4.00%
CPI3.7% YoY
Core CPI2.6% YoY
Unemployment4.1%
Cedar Global MarketsData via FRED® (St. Louis Fed). Not endorsed by the St. Louis Fed. Delayed / as published.

U.S. Wholesale Prices Rise 0.3% in October as Annual Rate Hits 6.5%, Highest Since 2022

in Economy, Americas
Reading Time: 2 mins read
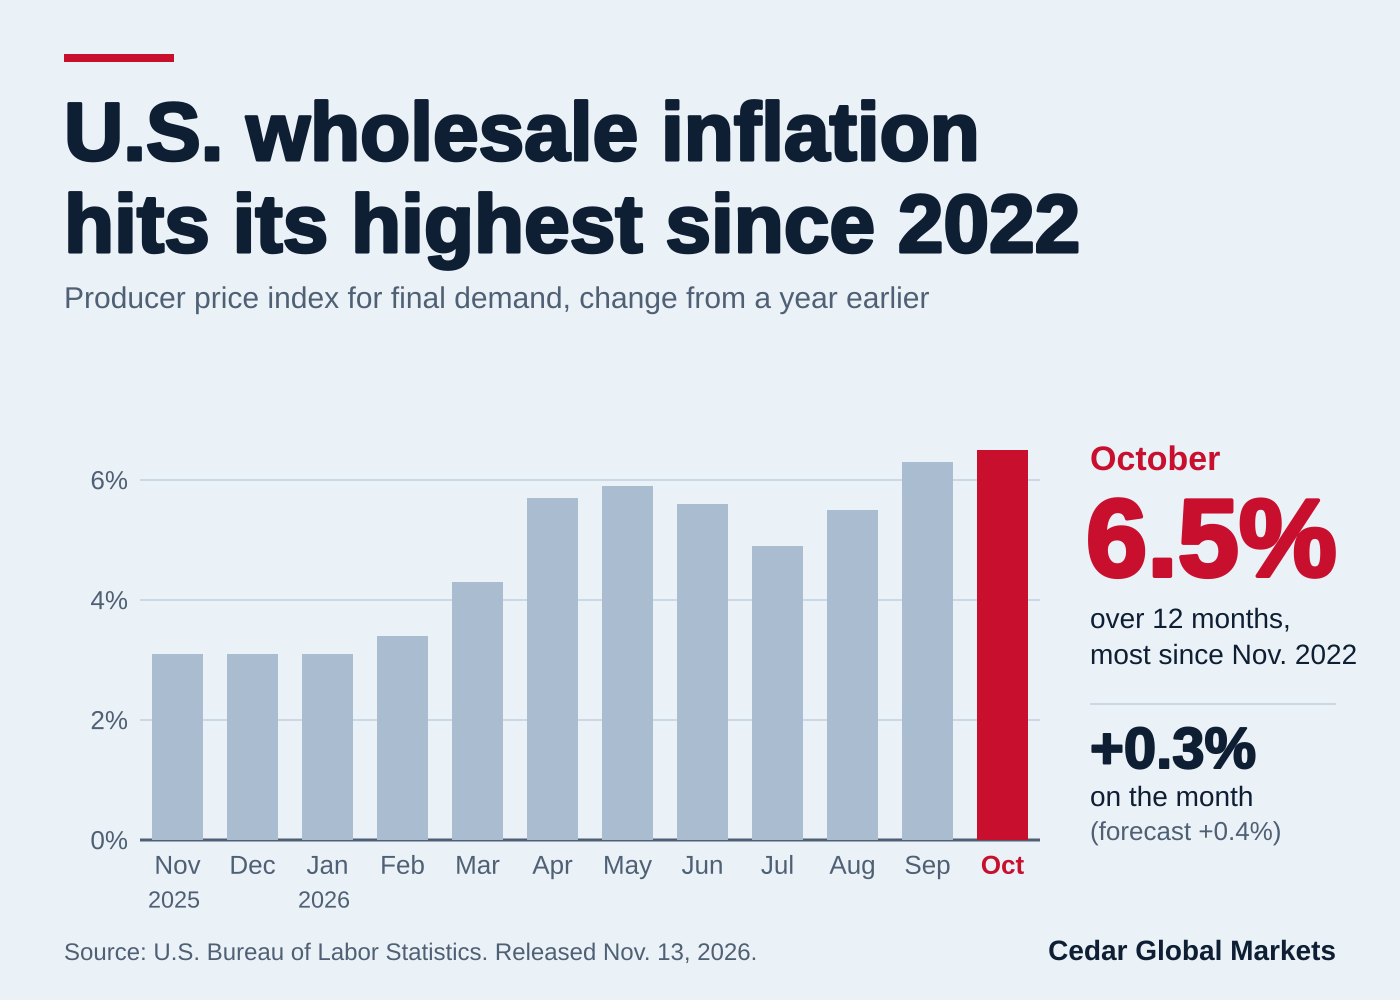
Bar chart of the U.S. producer price index for final demand, change from a year earlier, November 2025 to October 2026, rising to 6.5% in October, the most since November 2022; October rose 0.3% on the month versus a 0.4% forecast.
byCedar Global Markets
November 13, 2026
0
Share on Facebook
Share on X

U.S. producer prices rose 0.3% in October, the Bureau of Labor Statistics said Friday at 8:30 a.m. ET, slowing from a revised 1.4% jump in September. Over the 12 months through October, the producer price index for final demand climbed 6.5%, the largest annual increase since November 2022, when it rose 7.4%.

The monthly gain was a little below the 0.4% that economists expected in a Dow Jones survey and a Reuters poll. Core producer prices, which exclude food and energy, rose 0.3% for the month, in line with forecasts, and were up 5.0% from a year earlier. A narrower measure that also leaves out trade services rose 0.5%, matching September, and was up 4.9% over 12 months.

Goods prices rose 0.5%. More than 60% of the overall October increase came from goods other than food and energy, which rose 0.5%, while food prices jumped 1.3% and energy prices edged down 0.1%, the BLS said. Goods prices are up 10.2% from a year earlier. Services prices rose 0.2%, their fifth straight monthly increase, as the cost of trucking freight climbed 3.9%.

Stock futures added to their gains after the report. Shortly after 9 a.m. ET, S&P 500 and Dow futures were up about 0.4% and Nasdaq 100 futures were up about 0.1%. The 10-year Treasury yield was about 5.14%, up roughly 4 basis points on the day and still above 5%.

The report comes ahead of the Federal Reserve’s Dec. 8-9 policy meeting. Traders expect the Fed to raise interest rates by at least a quarter point at that meeting, and some see a chance of a half-point increase, according to CNBC and Reuters.

…

That’s the story. … Thank you for listening to Cedar Global Markets. We’re supported by our partners, and you can learn more about the partner featured on this page. We’ll see you next time.

TradingView partner
Tags: Homepage Latest Briefing

Related Posts

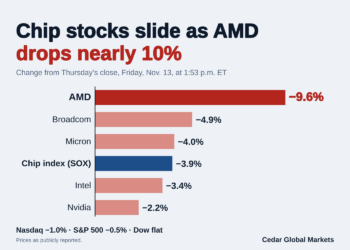
Bar chart of chip stocks on Friday, Nov. 13, 2026, at 1:53 p.m. ET: AMD down 9.6%, Broadcom 4.9%, Micron 4.0%, the PHLX Semiconductor Index 3.9%, Intel 3.4% and Nvidia 2.2%.

Chip Stocks Slide as AMD Drops Nearly 10%, Dragging the Nasdaq Lower

by Cedar Global Markets
November 13, 2026
0

Philadelphia chip index down 3.9% near 10,094; AMD down 9.6% to about $529; Nasdaq down 1% at 1:53...

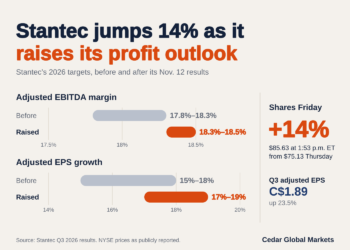
Chart comparing Stantec's old and raised 2026 outlook ranges for adjusted EBITDA margin and adjusted EPS growth, with shares up 14% on Nov. 13, 2026.

Stantec Jumps 14% After a Record Margin and a Raised Profit Outlook

by Cedar Global Markets
November 13, 2026
0

Stantec near $85.63, up $10.50 or 14% from Thursday's $75.13 close, after Q3 adjusted EPS rose 23.5%.

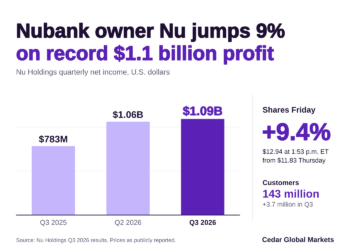
Bar chart of Nu Holdings quarterly net income reaching a record $1.1 billion in the third quarter of 2026, with shares up 9.4% on Nov. 13.

Nubank Owner Nu Holdings Jumps 9% After Record $1.1 Billion Quarterly Profit

by Cedar Global Markets
November 13, 2026
0

Nu near $12.94, up $1.11 or 9.4% from Thursday's $11.83 close, after record Q3 net income of $1.1...

Latest Briefing

Chip Stocks Slide as AMD Drops Nearly 10%, Dragging the Nasdaq Lower

November 13, 2026

Stantec Jumps 14% After a Record Margin and a Raised Profit Outlook

November 13, 2026

Nubank Owner Nu Holdings Jumps 9% After Record $1.1 Billion Quarterly Profit

November 13, 2026

Bitcoin Falls Below $69,000 to Its Lowest Since August

November 13, 2026
Next Post
Line chart of Microsoft's share price on Thursday and Friday, Nov. 12-13, 2026, with the global Outlook and Teams outage shaded from Thursday afternoon; the stock was near $520.75, down 0.4%, at 9:45 a.m. ET after falling as much as 1.8%.

Microsoft Shares Dip as Outlook and Teams Outage Runs Into a Second Day

Cedar Global Markets

Categories
  • Africa
  • Americas
  • Asia-Pacific
  • Banking
  • Business
  • Commodities
  • Economy
  • Energy
  • Europe
  • Global
  • Industry
  • Market Glance
  • Markets
  • Middle East
  • Opinion
  • Policy
  • Technology
  • Trade
[mc4wp_form]

© 2026 Cedar Global Markets  ·  About Us  ·  Contact  ·  Advertise  ·  Partners  ·  Privacy  ·  Terms

Welcome Back!

Login to your account below

Forgotten Password?

Retrieve your password

Please enter your username or email address to reset your password.

Log In
No Result
View All Result
  • Home
  • Markets
  • Economy
  • Business
  • Energy
  • Technology
  • Global
    • Middle East
    • Europe
    • Asia-Pacific
    • Americas
    • Africa
  • Opinion
SAVED POSTS

© 2026 Cedar Global Markets